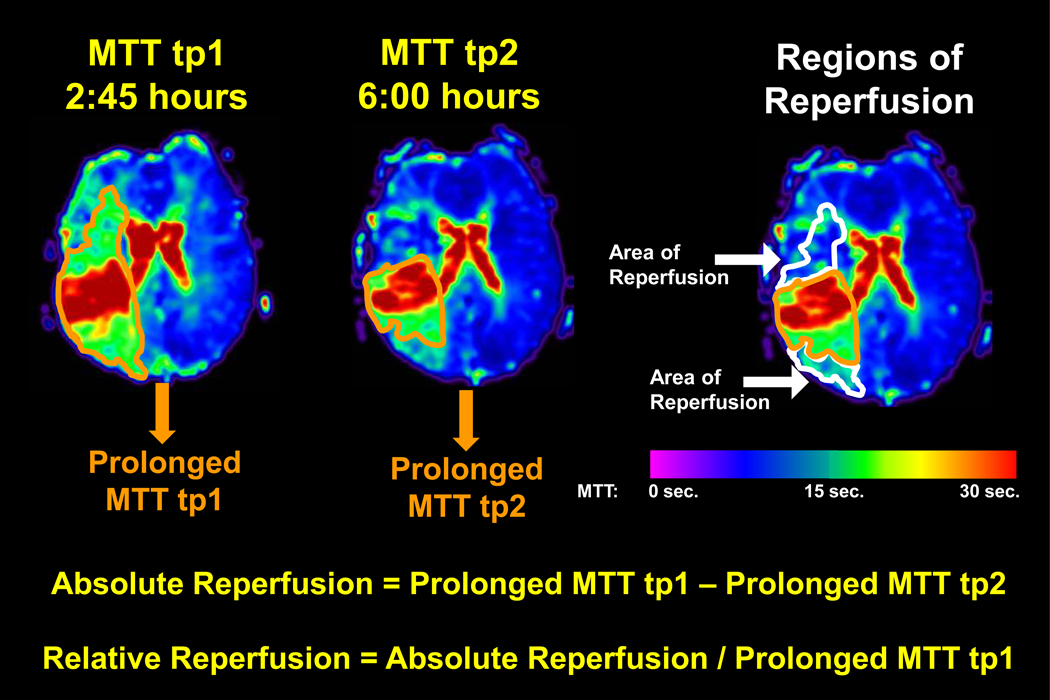
Figure 1. Calculation of Relative Reperfusion.
MTT maps were prepared for each time-point. For each MTT threshold, all voxels with values > the chosen MTT threshold were defined as “prolonged”. Prolonged MTT volumes provided a measure of the perfusion deficit volume at tp1 and tp2. Absolute and relative reperfusion volumes were calculated as shown. Warm colors represent maximal hypoperfusion with longer MTT and cool colors represent no hypoperfusion with short MTT, as shown on the color bar. The orange outline delineates a perfusion deficit defined by an MTT threshold > 4 seconds longer than the median MTT of the contralateral hemisphere. At tp2, the perfusion deficit shrinks; thus, the white outline delineates regions of reperfusion using this threshold (> 4 seconds).

