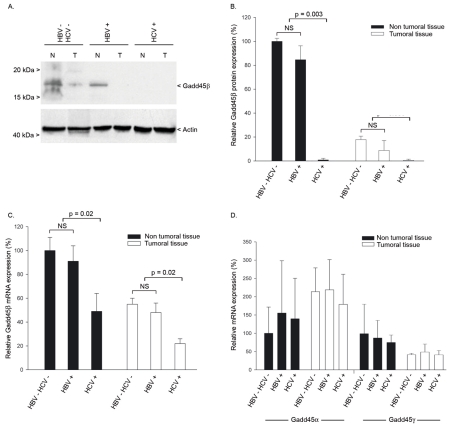
Fig. 1. Gadd45β expression in tumoral and non-tumoral tissues from HCV-infected patients.
(A) Gadd45β protein expression in tumoral (T) and adjacent non-tumoral (NT) liver samples from uninfected (HBV−/HCV−), HBV-infected (HBV+) or HCV-infected (HCV+) patients. Tissue samples were analyzed by western blotting, and bands corresponding to 18 kDa Gadd45β or 45 kDa actin are indicated. (B) Densitometric quantification of multiple western blot analyses of tumoral and non-tumoral tissues from HBV−/HCV− (n=5), HBV+ (n=5) and HCV+ (n=7) patients. Gadd45β protein levels were normalized to the expression of actin, and mean±SEM densities are displayed in relation to non-tumoral non-infected (HBV−/HCV−) tissues. (C) Gadd45β mRNA expression in non-tumoral and tumoral liver tissues from HBV−/HCV− (n=5), HBV+ (n=5) and HCV+ (n=7) patients. Expression levels of Gadd45β and SFRS4 transcripts were determined by real-time PCR. Data were normalized to expression of SFRS4, and expressed as the mean±SEM mRNA expression. (D) Gadd45α and Gadd45γ mRNA expression in non-tumoral and tumoral liver tissues from HBV−/HCV− (n=5), HBV+ (n=5) and HCV+ (n=7) patients. Gadd45α, Gadd45γ and SFRS4 transcripts were quantified by real-time PCR. Data were normalized to SFRS4 expression, and expressed as the mean±SEM mRNA expression for each gene. None of the comparisons showed significant differences.

