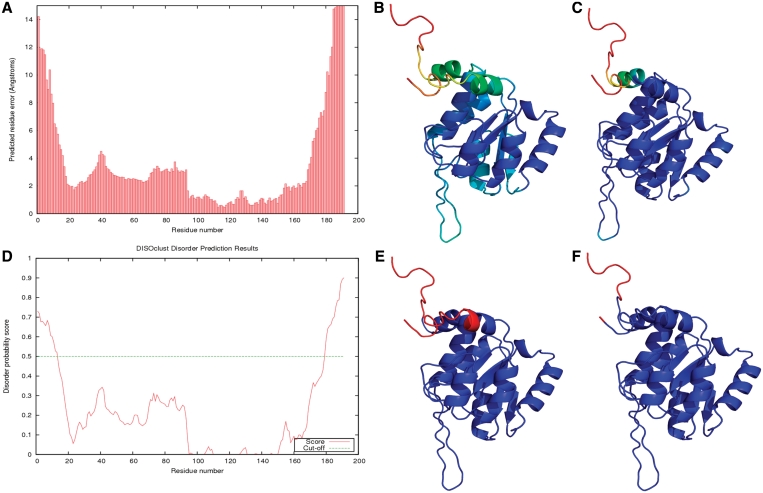
Figure 3.
IntFOLD results for CASP9 target T0635 (PDBID 3n1u). The results for ModFOLD 3.0 (A), nFOLD4 (B), DISOclust 2.0 (D and E) are shown, along with the observed per-residue error (C) and the observed disordered residues (F). (A) The predicted per-residue error in Ångströms. (B) The predicted per-residue error mapped onto the top nFOLD4 model, colored from red to blue (bad to good). (C) The observed per-residue error mapped onto the top nFOLD4 model, again colored from red to blue (bad to good). (D) The disorder prediction plot from DISOclust 2.0. (E) The DISOclust 2.0 results for the top nFOLD4 model, with the residues predicted as disordered highlighted in red. (F) The top nFOLD4 model with the observed disordered residues and residues not present in the experimental structure colored red.

