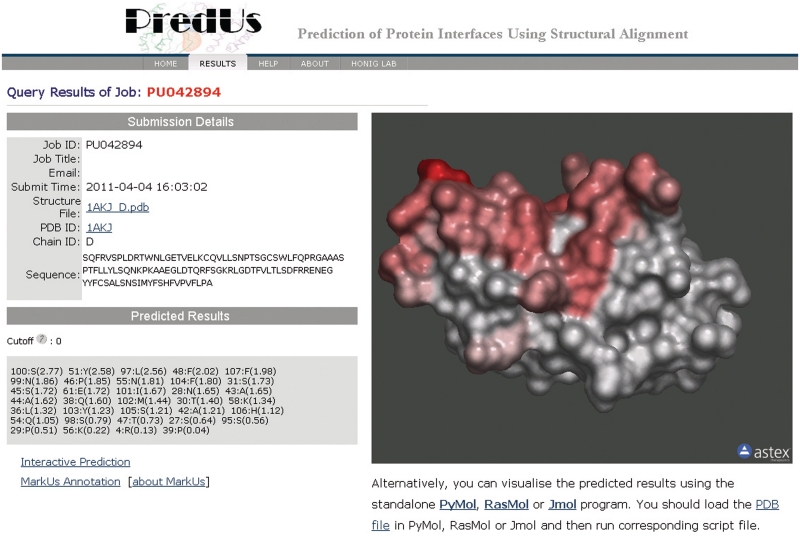
Figure 1.
PredUs prediction output. The left of the figure shows the submission details and prediction results. All residues with interfacial score higher than zero are shown with scores in parentheses following residue number (in the PDB structure file) and residue name. On the right is the submitted structure with its molecular surface rendered in colors according to residue interfacial score. Residues of score higher than zero are shown from light red to red as the score increases.

