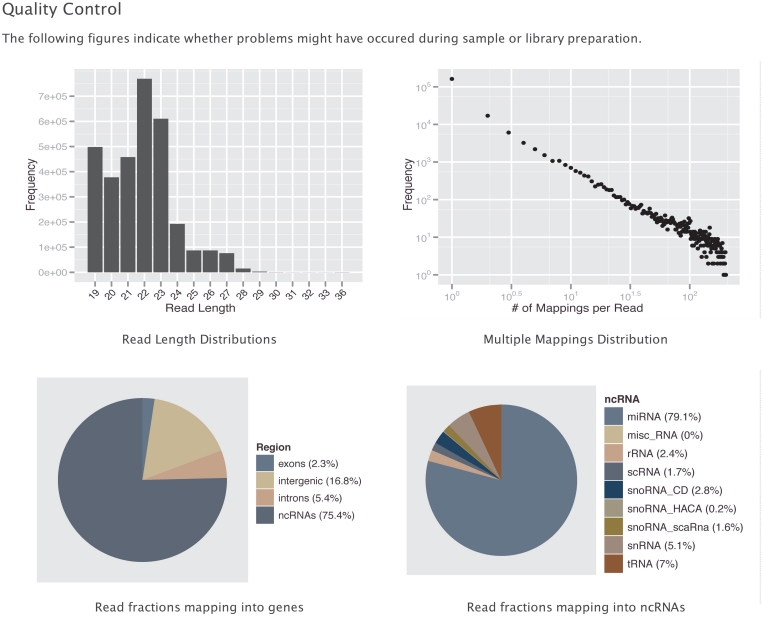
Figure 2.
The DARIO web server provides a set of graphics for quality control. The figures show the read length distribution, the number of multiple mappings, the distribution of mapping loci across the genome and the annotated non-coding RNAs. The user may immediately check the success of his short RNA sequencing run in terms of capturing the ncRNA of interest.

