Figure 1.
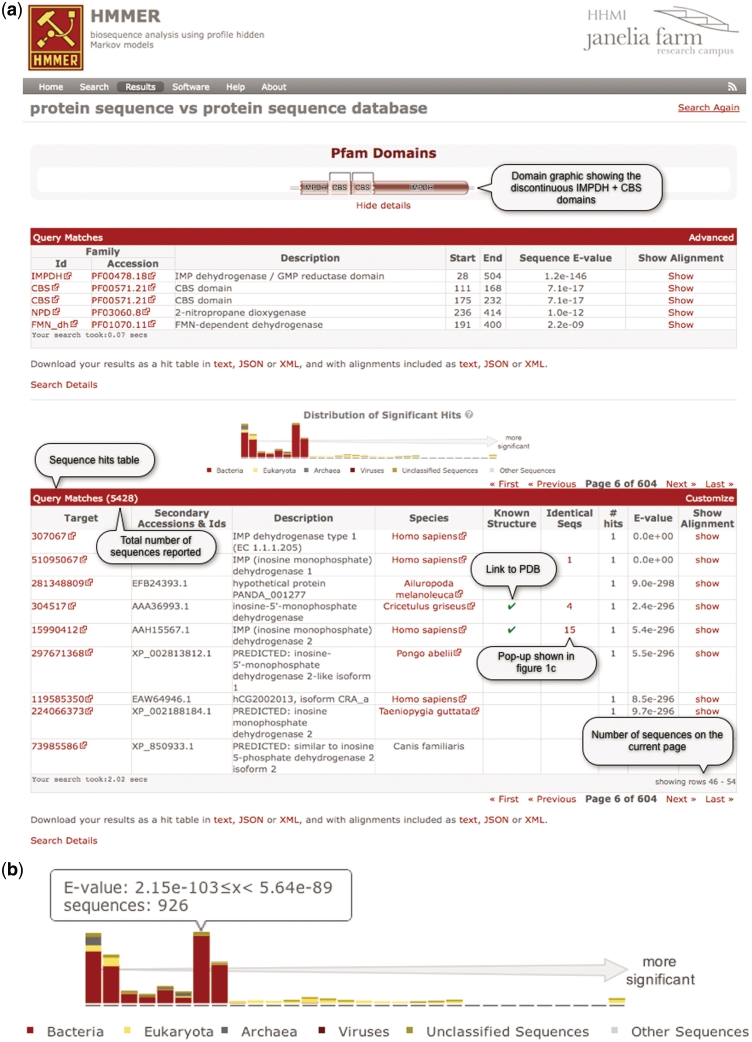
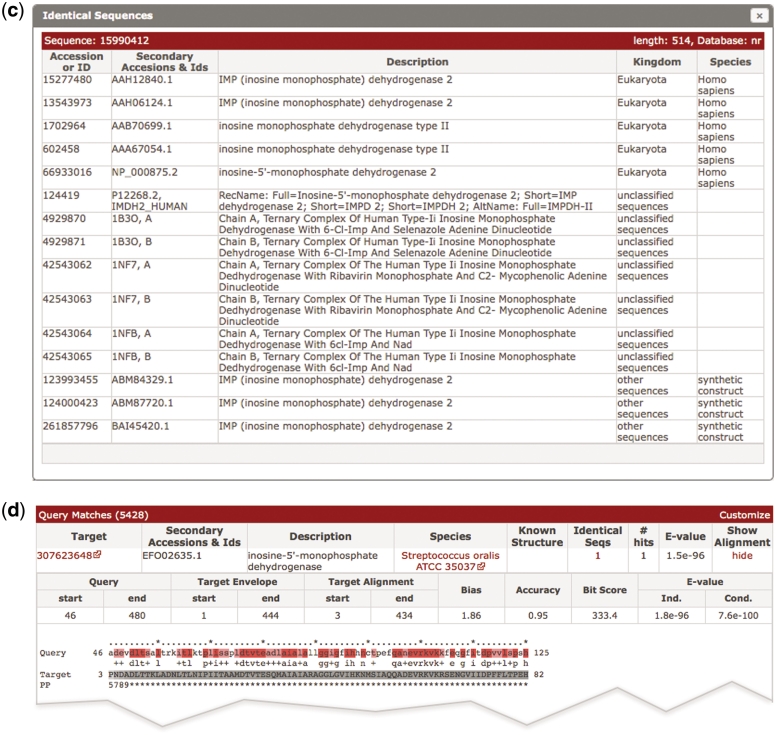
(a) A screen shot of the phmmer search results page, using the sequence IMDH1_HUMAN (UniProtKB) and default parameters. The results from the ‘Pfam search’ are shown as both a graphic and as a table, which has been revealed in this figure. Below this is a hit distribution graph and a table of the results from the phmmer search. Key features in the table are labeled and discussed in the text. This search resulted in over 5000 sequence matches, which are accessible either by going through the paginated table or can be navigated using the hit distribution histogram. (b) An enlarged version of the hit distribution graph, showing the taxonomic ranges of sequences matched in the search. The tool tip indicates the E-value range represented by the bar, and the number of sequences from the search that fall within the range.(c) As more and more sequences are being deposited, the large comprehensive sequence databases contain increasing numbers of duplicate sequences. There is no need to show an identical sequence match several times, but the annotation assigned to these duplicate sequences can differ. Thus, we indicate when we have not displayed identical sequences with a number in the results table (Figure 1a). When this number is clicked, a ‘pop-up’ displays the additional annotations for the sequence numbers. As in this example, when there are more than 20 sequences, the list is paginated. (d) Example of an alignment between a match and a query. When the show link is clicked in the results table as shown in (a), the table is expanded to show the alignments between the query and the target sequence. The query is color coded according to the match line found below it in the alignment block (identical residues are colored red similar to pink). The target sequence is colored according to the posterior probability, with lighter shades of gray indicating regions where the alignment confidence is lower. Each number in the ‘PP’ line represents the probability (or alignment accuracy) that the residue in the row above is assigned to the corresponding HMM state found in the first row of the alignment block. The posterior probability is encoded as 11 possible characters 0–9*: 0.0 ≤ P < 0.05 is coded as 0, 0.05 ≤ P < 0.15 is coded as1, and so on, 0.85 ≤ P < 0.95 is coded as 9 and 0.95 ≤ P ≤ 1.0 is coded as ‘*’.


