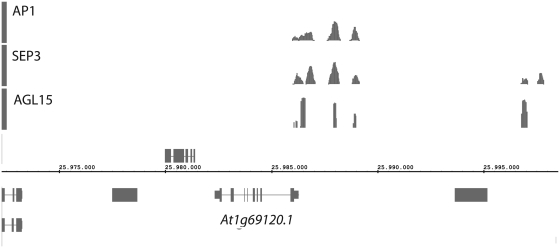
Figure 1.
DNA binding maps of three MADS-box TFs in the promoter region of the AP1 gene (indicated below, At1g69120). From top to bottom: AP1, SEP3 and AGL15. The visualization of multiple binding maps can provide useful information; in the current display, for example, it appears that the binding sites of the three TFs map to the same genomic positions. This can be explained by the fact that they form dimers with each other (1).

