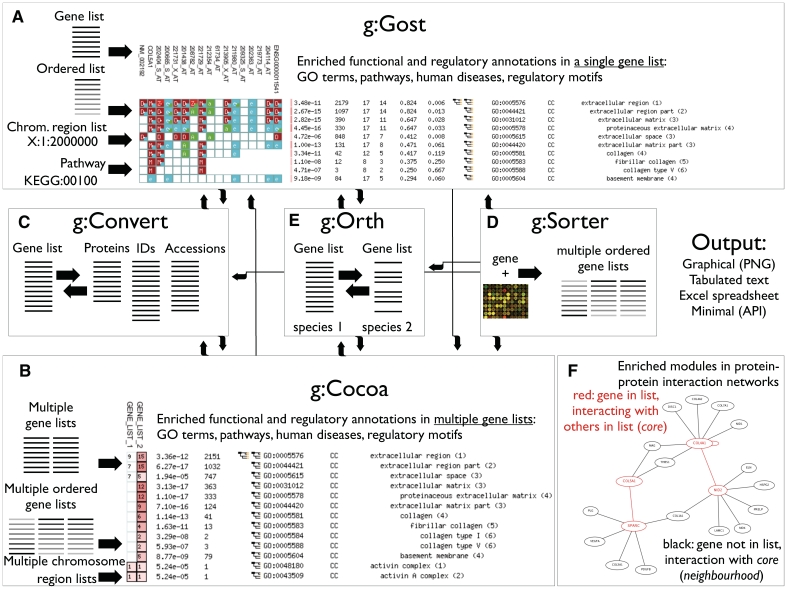
Figure 1.
g:Profiler tools (A–E) and data streams (arrows) for constructing analysis pipelines. (A) g:GOSt—functional profiling of gene lists, with sources of input shown on the left [also see (F)]. Output: genes are shown horizontally and annotations vertically, colours denote classes of functional evidence. (B) g:Cocoa—functional profiling of multiple gene lists. Output: gene lists are shown horizontally and annotations vertically, colours (intensity of red) denote strength of enrichment. (C) g:Convert—ID mapping service for kinds of molecules and databases. (D) g:Sorter—gene-based expression similarity search from microarrays. (E) g:Orth—mapping homologous genes of related species. (F) Identification of enriched protein–protein interaction modules in gene lists. A fragment of g:GOSt output includes a module of interacting query genes (core, red) and non-query genes interacting with the core module (neighbourhood, black).

