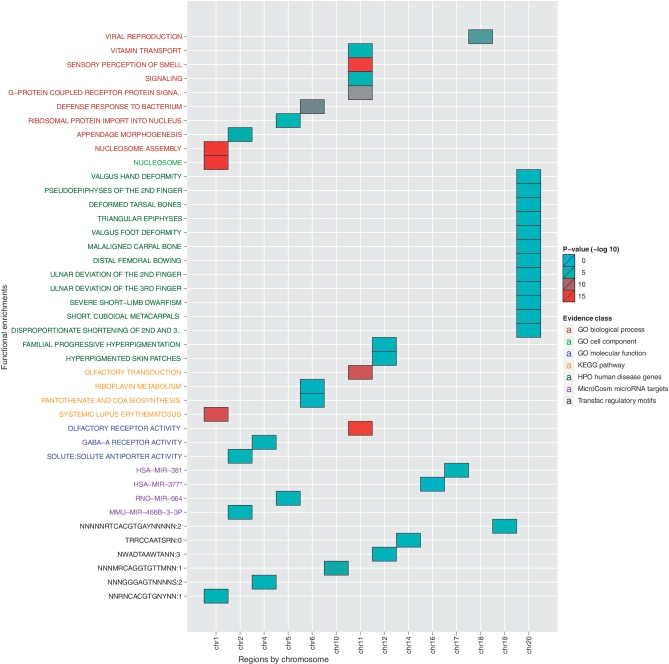
Figure 2.
Functional analysis of positively selected regions in modern human genome versus Neanderthal genome. Input genomic loci were grouped by chromosome and analysed with g:Cocoa. R was used for visualization. Enriched annotations are shown vertically and chromosomes horizontally. Coloured cells indicate statistically significant enrichments of corresponding functions (P < 0.05, red tones represent greater significance). Annotation axis labels are grouped and coloured according to data source. To avoid redundant annotations, only most significant function of any hierarchically related group is shown.

