Figure 1.
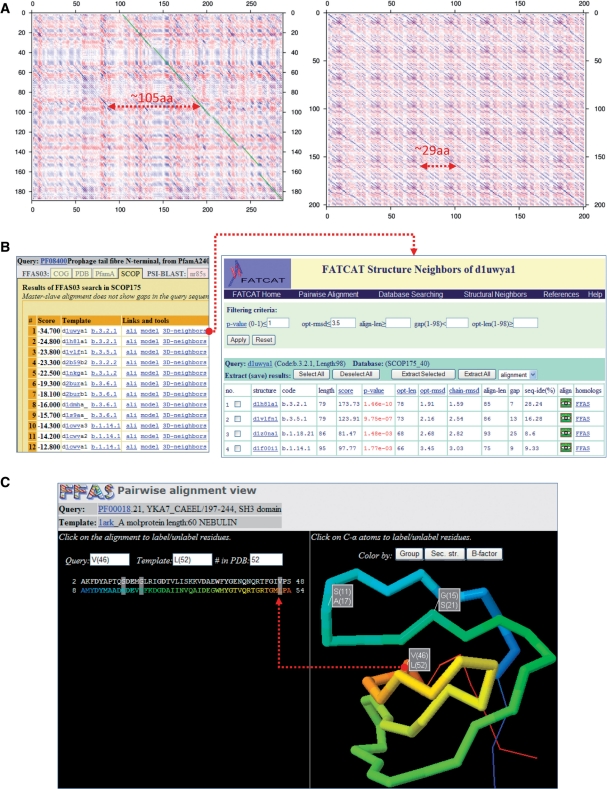
Examples of novel features of the FFAS server. (A) Dotplot graphs generated with the new FFAS tool. Left panel: the dotplot graph of a leucine-rich repeat region of the human NACHT protein compared to itself. Right panel: the dotplot graph visualizing similarity between C-terminal parts of SusE and SusF proteins from Bacteroides thethaiotaomicron. Arrows indicate the estimated lengths of repeats in NACHT LRRs and the lengths of repeated (homologous) domains in the alignment of SusE with SusF. (B) FFAS results are now linked to a database of structural similarities calculated with FATCAT. These links can be used to evaluate structural consistency of FFAS results. In this example, the fact that two different folds are aligned with the same query (Prophage tail fibre N-terminal domain) is explained by a list of structural neighbors that shows that a Prealbumin-like fold (b.3 code in SCOP) and an Immunoglobulin-like beta-sandwich (b.1 code in SCOP) are structurally similar despite being classified as separate folds. (C) 3D alignment viewer allows quick inspection of the alignment as ‘projected’ on a template structure (labeling of residues in a Jmol viewer is synchronized with alignment labeling).

