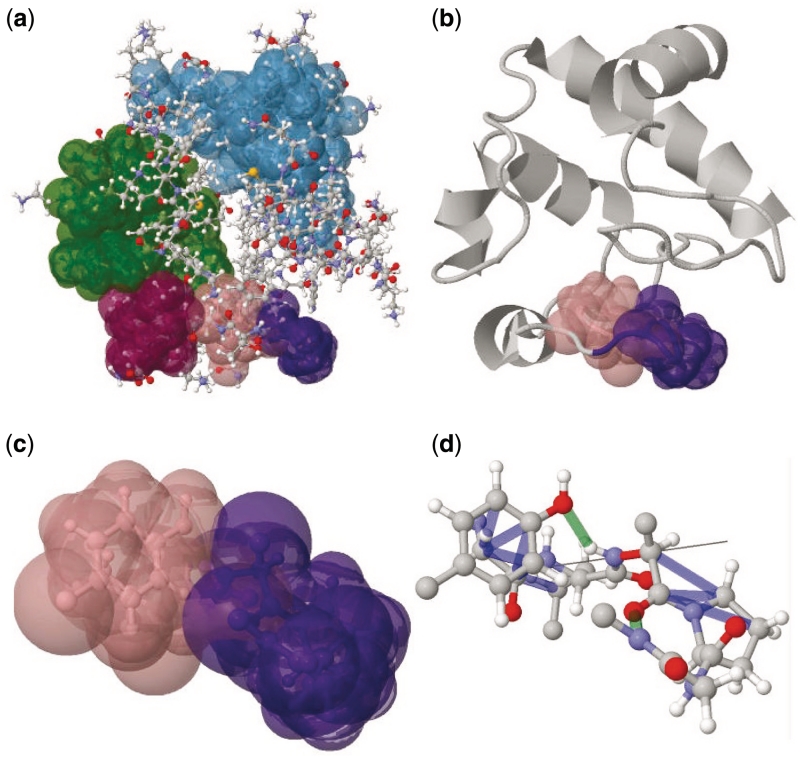
Figure 5.
The visualizer can be used to display different rigidity features of 1HRC. The quick-start option sets default curation and modeling parameters, and displays the largest rigid clusters as highlighted surfaces in a ball-and-stick model (a). Many other visualization options are available. The same protein can be viewed as a cartoon (b), two bodies that connect at a mechanical hinge can be shown (c), while hydrogen bonds and hydrophobic interactions can be displayed in the vicinity of a mechanical hinge region (d).

