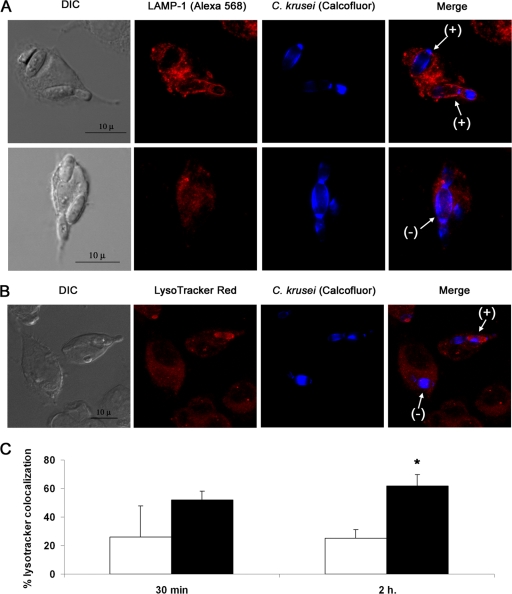
Fig. 3.
Phagosome maturation in RAW 264.7 macrophages infected with C. krusei. (A) Confocal microscopy of Lamp1 localization (red fluorescence) in macrophages with C. krusei cells (blue fluorescence) internalized after 1 h of phagocytosis. Arrows indicate positive (+; top row) and negative (−; bottom row) colocalization of Lamp1 with C. krusei. The scale bar shown in the first panel applies to the rest of the panels in the same row. (B) LysoTracker red localization in infected macrophages by confocal microscopy. C. krusei was stained with calcofluor white. Arrows indicate positive and negative colocalization of the dye with the yeast cells. The scale bar shown in the first panel applies to the rest of the panels in the same row. (C) The colocalization of C. krusei and the dye was measured by fluorescent microscopy after 30 min and 2 h of phagocytosis. The experiment was performed in triplicate, and the average values and standard deviations were plotted in the bar graphs. Black bars represent colocalization of heat-killed C. krusei and LysoTracker, while white bars represent colocalization of live yeast cells and the fluorescent dye. The asterisk denotes statistical difference (P < 0.05).

