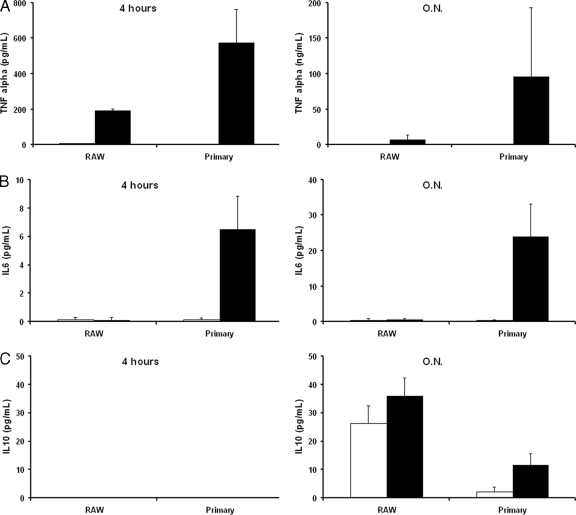
Fig. 6.
Cytokine production by RAW 264.7 and primary macrophages. RAW 264.7 and primary macrophages were exposed to C. krusei, and the cytokines produced were measured as described in Materials and Methods after 4 h and overnight incubation (O.N.). The experiment was performed in triplicate, and the average values and standard deviations are plotted in the bar graphs. (A) TNF-α; (B) IL-6; (C) IL-10. Black bars, macrophages exposed to C. krusei; white bars, control macrophages not infected with yeasts.

