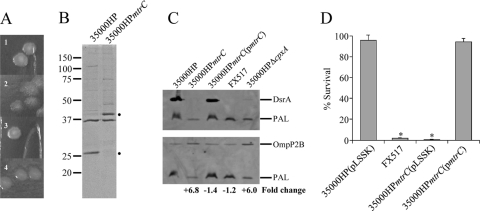
Fig. 3.
Pleiotropic phenotypes of 35000HPmtrC. (A) Colony morphologies of 35000HP(pLSSK) (1), 35000HPmtrC(pLSSK) (2), 35000HPmtrC(pmtrC) (3), and 35000HPΔcpxA (4) on chocolate agar plates after 3 to 4 days of growth. (B) Coomassie-stained outer membrane proteins of 35000HP and 35000HPmtrC. The dots to the right of the blot indicate changes in band expression in 35000HPmtrC. (C) Western blot of whole-cell lysates of 35000HP, 35000HPmtrC, 35000HPmtrC(pmtrC), FX517, and 35000HPΔcpxA probed with PAL-specific monoclonal antibody 3B9, as a loading control, and either DsrA-specific (top) or OmpP2B-specific (bottom) antibodies. The fold change in OmpP2B expression compared to the parent strain, after normalization to PAL, is indicated at the bottom. (D). Survival of 35000HP(pLSSK), FX517, 35000HPmtrC(pLSSK), and 35000HPmtrC(pmtrC) in 50% normal human serum (NHS). The data represent the means and standard errors of three independent assays. The asterisks indicate significant differences from 35000HP(pLSSK) (P = 0.005).

