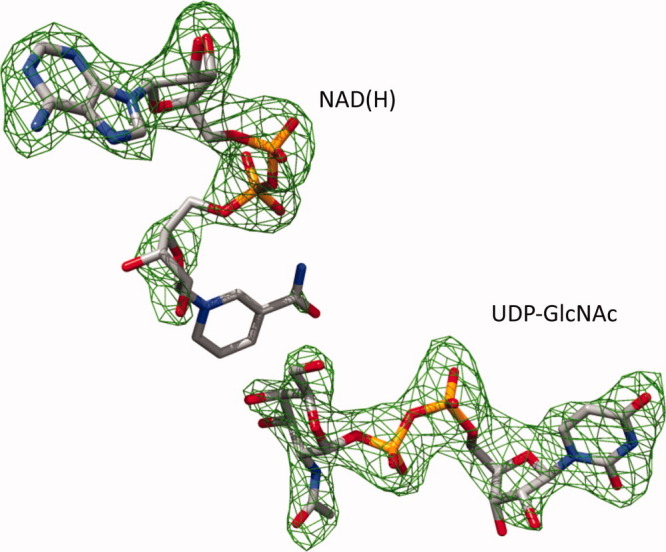
Figure 1.

Difference electron density map at the active site of WbgU. Fo-Fc electron density map in the region of UDP-GlcNAc and NAD(H) depicted at an absolute electron density of 0.15 e/Å3 corresponding to 3.0σ cutoff. [Color figure can be viewed in the online issue, which is available at wileyonlinelibrary.com.]
