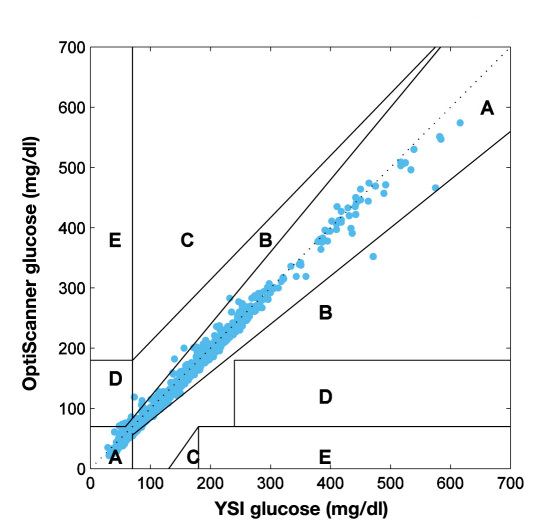
Figure 2.
Clarke error grid analysis of 1155 paired glucose samples (OptiScanner vs. YSI) from 60 subjects. The data shows 99% of values in zone A. Only 16 out of 1155 values fell outside of zone A, being randomly distributed throughout the patient population. Only 0.8% were in zone B and 0.6% in zone D: 75% of patients had 100% of values within zone A. Of those patients with values outside zone A, 23% had only one value and 2% had two values outside zone A.

