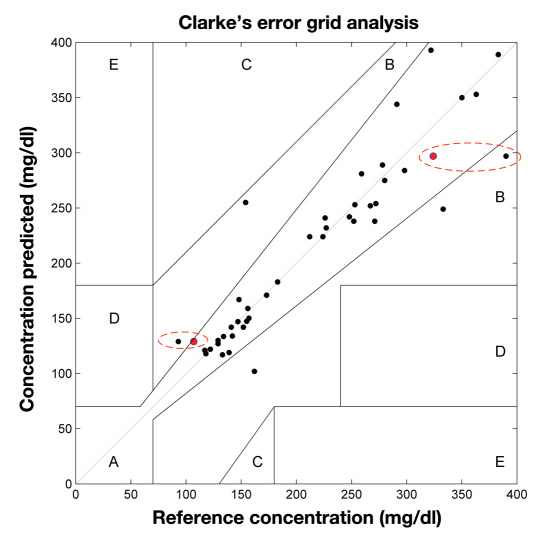
Figure 6.
Clarke error grid showing 41 points, with 93% in region A and the remainder in region B. The reference concentrations are from a handheld glucometer (One Touch Ultra, Lifescan Inc.), except for circled points. Circled points additionally have YSI-measured concentrations as reference (red points) and show the predicted values are closer to the YSI measurements than the handheld meter.

