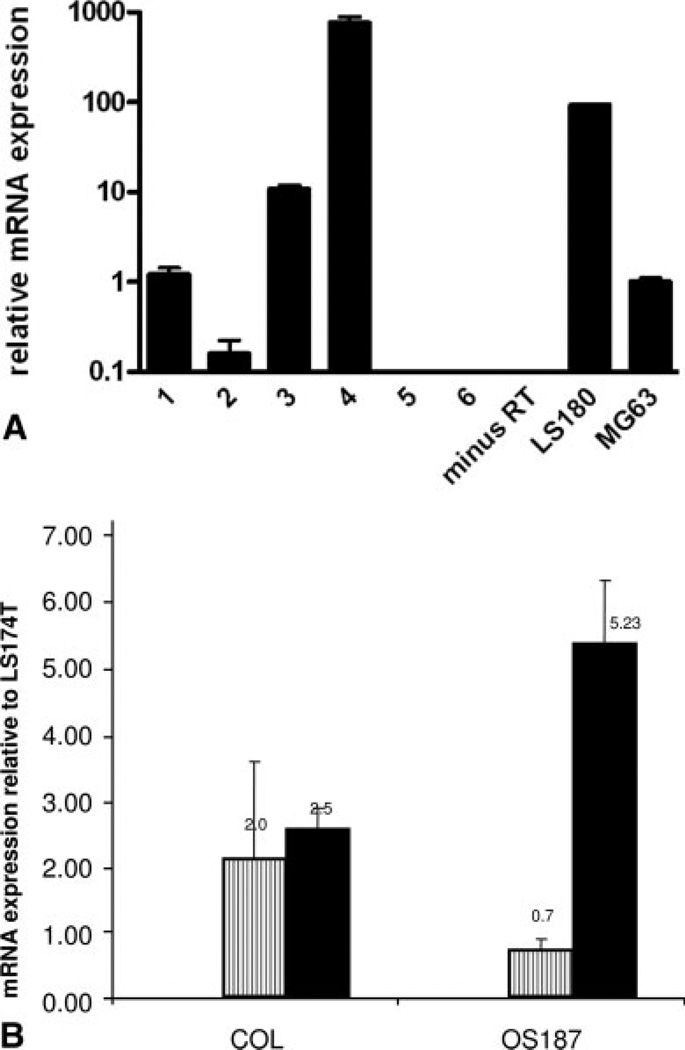
FIGURE 1.
(A) PXR expression in osteosarcoma cell lines. Total RNA was isolated from a number of primary and stable sarcoma cell lines. Real-time polymerase chain reaction (PCR) was performed using the SYBR Green-PCR-Master-Mix (Applied Biosystems, Foster City, CA). cDNA was made using Superscript III from Invitrogen (La Jolla, CA) using 1 µg total RNA input. Osteosarcoma cell line MG63 was set as 1 and all expression was determined relative to MG63. The colon adenocarcinoma cell line LS180 was used as positive control and minus RT for negative control. Expression is depicted on a logarithmic scale to facilitate comparison of widely divergent expression levels. Lanes 1–6 represent: primary osteosarcoma cell line (COL); liposarcoma; osteosarcoma cell line (SAOS2); primary synovial sarcoma cells; primary embryonal rhabdomyosarcoma cells (no RNA detected); rhabdomyosarcoma cells (no RNA detected), respectively. (B) Quantitative RT-PCR for P450 3A4 and MDR1 in COL and OS187 cells. P450 3A4 or MDR1 levels were determined relative to LS174T mRNA and represented as P450 3A4 (−) and MDR1 (−). mRNA values represent the average of triplicates, standardized to the expression of GAPDH.

