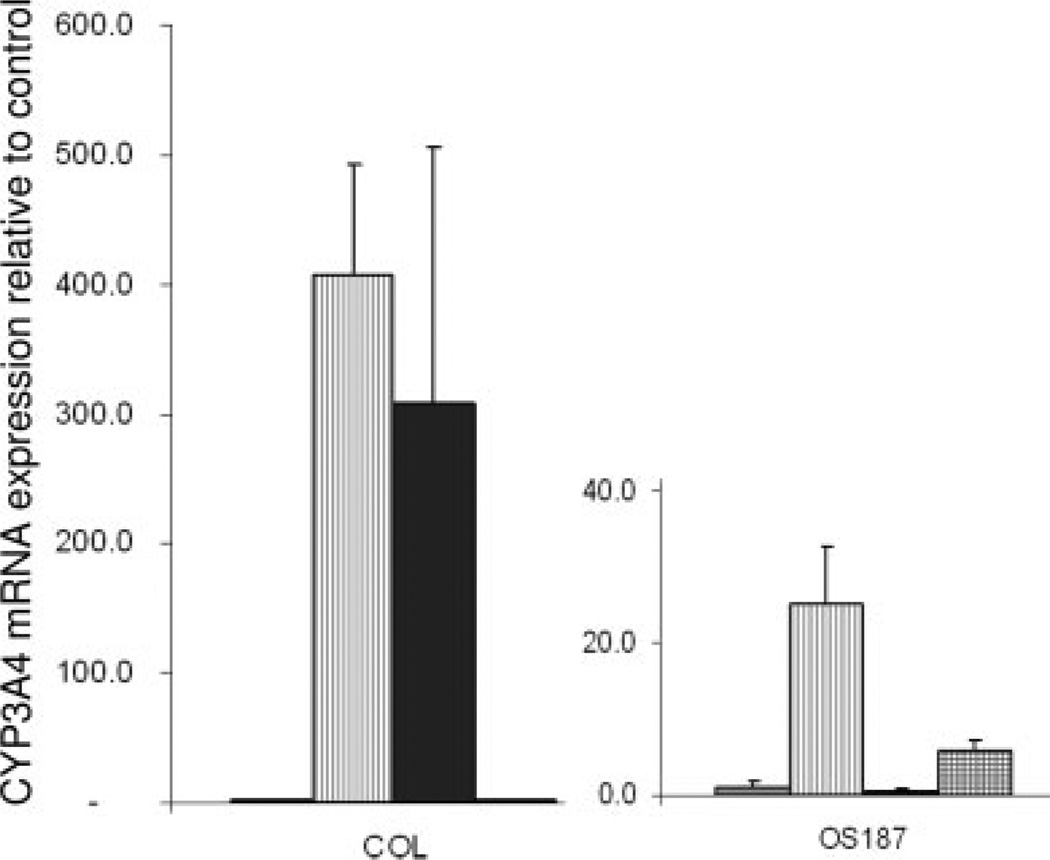
FIGURE 6.
Induction of P450 3A4 mRNA levels in OS187 and COL cells by etoposide (–), doxorubicin (–), and ifosfamide (–). P450 3A4 mRNA expression levels were determined by quantitative reverse-transcriptase polymerase chain reaction (RT-PCR). The values represent the average of triplicates standardized to GAPDH expression and are represented relative to untreated controls for each cell line. (–) represents control untreated cells.

