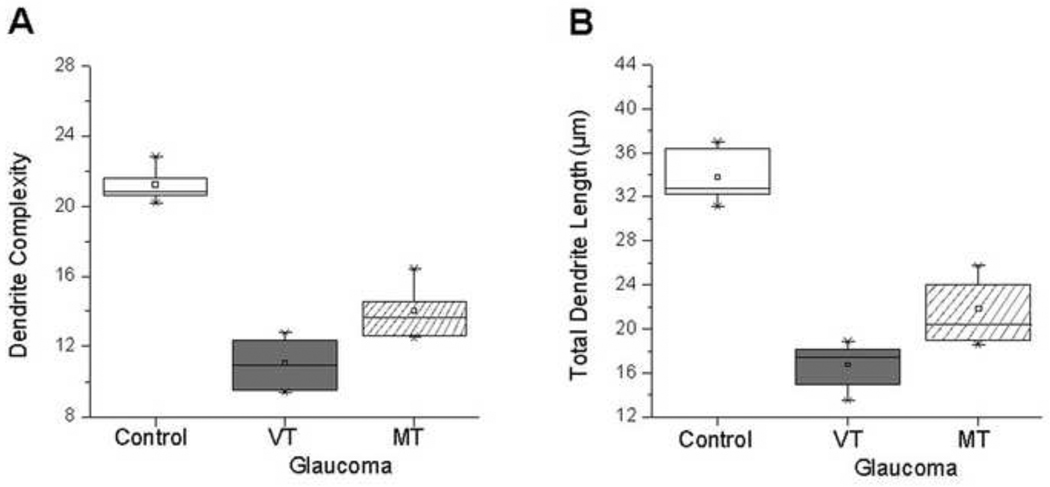
Figure 4.
Parvocellular layer 6: Box plots for dendrite complexity (A) and dendrite length (B) in the normal group, and VT and MT glaucoma groups. Compared to normal group, dendrite complexity and dendrite length were reduced in VT glaucoma group. Dendrite complexity and dendrite length in MT glaucoma group were significantly increased compared to VT glaucoma group (P = 0.0011; P = 0.0012, respectively). The box extends from the 25th percentile to the 75th percentile, with horizontal solid line and square at the median and mean, respectively. The bars indicate the highest and lowest values determined by the 25th and 75th percentiles.

