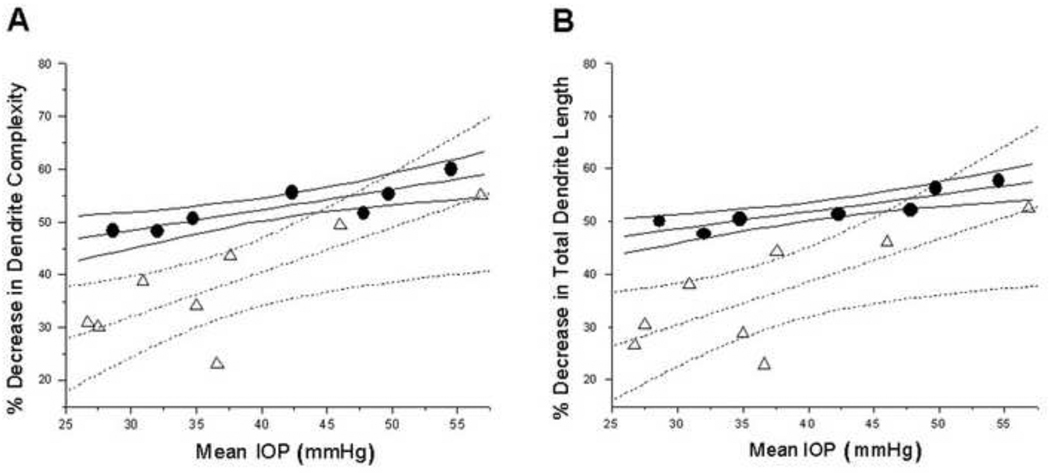
Figure 5.
Magnocellular layer 1: Plots of percent dendrite complexity reduction (A) and percent dendrite length reduction (B) as a function of mean IOP. Triangles and circles indicate percent decrease in dendrite complexity in MT glaucoma group and VT glaucoma group, respectively. (A) Dotted and solid and lines represent linear fit and 95% confidence intervals for the MT and VT glaucoma groups, respectively. Percent decrease in dendrite complexity increased with elevated mean IOP. Similar results were obtained when percent dendrite length reduction was assessed (B)

