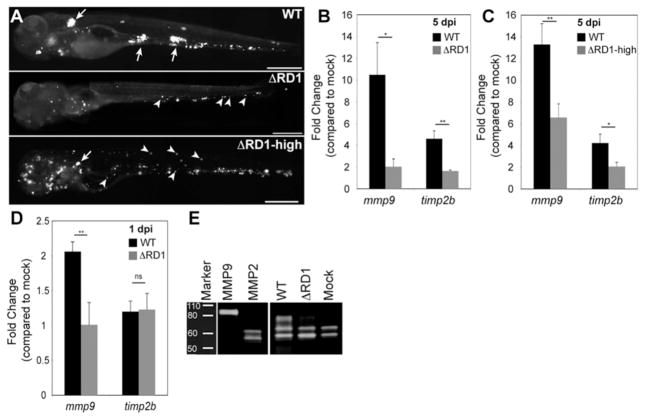
Fig. 1.
RD1-dependent Mmp9 induction. (A) Representative fluorescence images of 5 dpi embryos used for gene expression studies in (B and C). Embryos in top and middle panels injected with similar doses of WT and ΔRD1, respectively (WT dose 193±36 and ΔRD1 dose 217±63), where ΔRD1 bacterial burdens are lower than WT at 5dpi. Embryo in bottom panel injected with ~ 5-fold more ΔRD1 (ΔRD1- high) to achieve similar bacterial burdens to WT at 5 dpi (5 dpi bacterial burdens were 1601±1071 for WT and 1531±1011 for ΔRD1-high, ns). Arrows, granulomas; arrowheads, single infected macrophages. Scale bars, 400 μm. (B-C) Relative gene expression levels (mean ± SEM of at least 3 biological replicates) of 5 dpi (B) WT- and ΔRD1-infected embryos and (C) WT and ΔRD1- high-infected embryos. Although there appears to be a dose-dependent induction of mmp9 by ΔRD1 (compare induction in panels B and C), the difference is not significant (p=0.2). (D) Relative gene expression levels (mean ± SEM of 3 biological replicates) 1 day after injection with 721±39 WT or 484±147 ΔRD1 (ns). *p < 0.05, **p < 0.01, ns, not significant (Student’s t test). (E) Gelatin zymography of embryos 5 dpi with 200 WT or 700 ΔRD1, or mock-infected. Controls are purified human MMP9 and MMP2.

