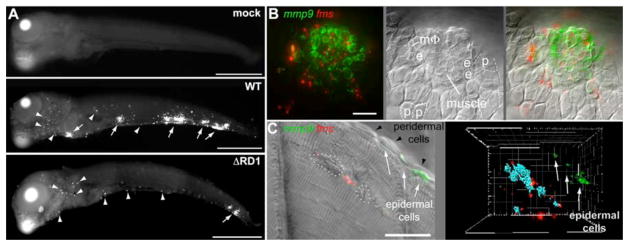
Fig. 3.
mmp9 is selectively induced in epithelial cells neighboring infected macrophages. (A) mmp9 FISH images of embryos 5 days after mock infection or infection with 78 CFU WT or 130 CFU ΔRD1. Arrows, mmp9 expression corresponding to granulomas, arrowheads, single mmp9-expressing cells. Scale bars, 400μm. (B and C) Images of WT granulomas after dual mmp9 and fms FISH. (B) Fluorescence (left), DIC (middle), and overlay (right) images. e, epidermal cell; p, peridermal cell; MΦ, macrophage. Scale bar, 20μm. Also see movie S1. (C) Fluorescence and DIC overlay of nascent WT muscle granuloma (left panel). Dotted white circles outline bacterial clusters discerned by DIC microscopy. Fluorescence data has been deconvolved. Right panel represents 3D reconstruction from fluorescence image of same lesion with bacterial locations pseudocolored blue, showing complete absence of mmp9 expression in adjacent muscle, and strong mmp9 expression in nearest neighboring epidermal cells. Scale bar, 20μm. Also see movie S2.

