
Fig. 1.
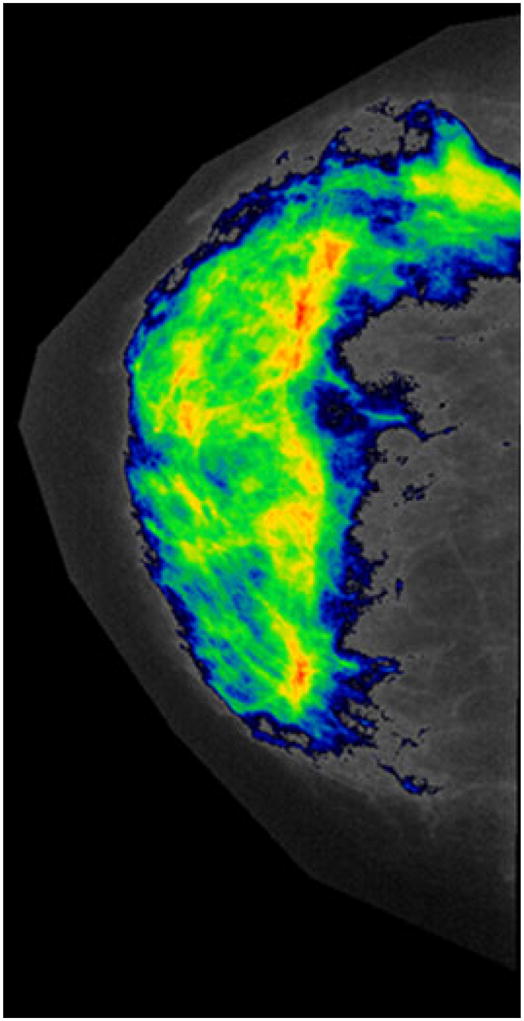
Representative digitized mammogram showing tinted pixels for MD calculation. The colors (ranging from the coolest blue to the hottest red) indicate increasing density, where red is representative of the densest tissue
Official websites use .gov
A
.gov website belongs to an official
government organization in the United States.
Secure .gov websites use HTTPS
A lock (
) or https:// means you've safely
connected to the .gov website. Share sensitive
information only on official, secure websites.
Representative digitized mammogram showing tinted pixels for MD calculation. The colors (ranging from the coolest blue to the hottest red) indicate increasing density, where red is representative of the densest tissue