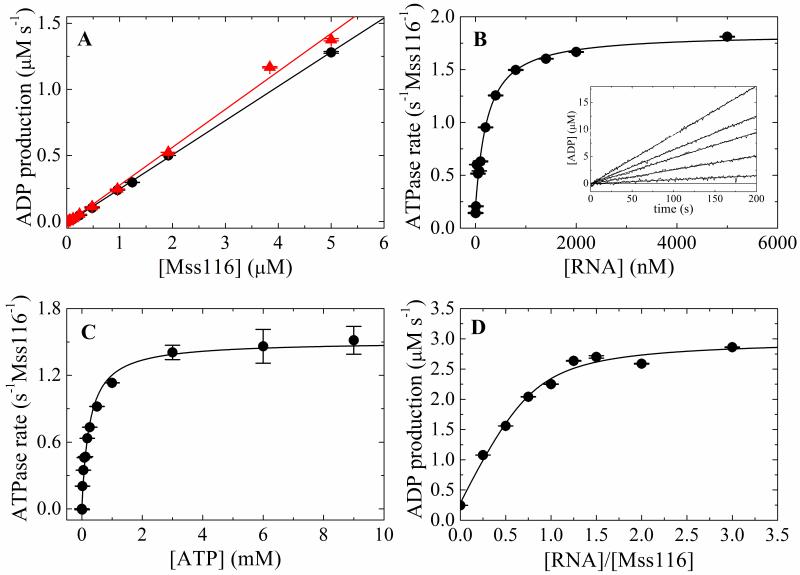
Figure 1. Steady-state ATPase activity of Mss116.
A. [Mss116]-dependence of intrinsic ATPase activity in the absence of RNA and presence of 10 mM MgATP with (filled triangles, red) and without (filled circle, black) RNase A. The slope yields a kcat of 0.26 s−1 Mss116−1 without RNase A and 0.29 s−1 Mss116−1 with RNase A. B. [RNA]-dependence of Mss116 steady-state ATPase rate in the presence of 10 mM MgATP. The solid line is the best fit to Eq. 10. The inset shows the time courses of steady state ADP production upon addition of 10 mM MgATP to a pre-equilibrated sample of 50 nM Mss116 and (lower to upper) 0, 50, 200, 400, 5000 nM RNA. The smooth lines represent the best fits to a line. C. [ATP]-dependence of Mss116 steady-state ATPase rate in the presence of 2 μM RNA. The kcat, and KM,ATP values obtained from the best fits to the hyperbolic form of the Briggs–Haldane (solid line) are listed in Table 1. D. [RNA]-dependence of Mss116 steady-state ATPase rate measured with 2 μM (>>KM,RNA) Mss116 in the presence of 2.4 mM MgATP for stoichiometry determination. The solid line is the best fit of the data to the implicit bimolecular binding equation (Supplementary material B) with the stoichiometry unconstrained during the fitting.

