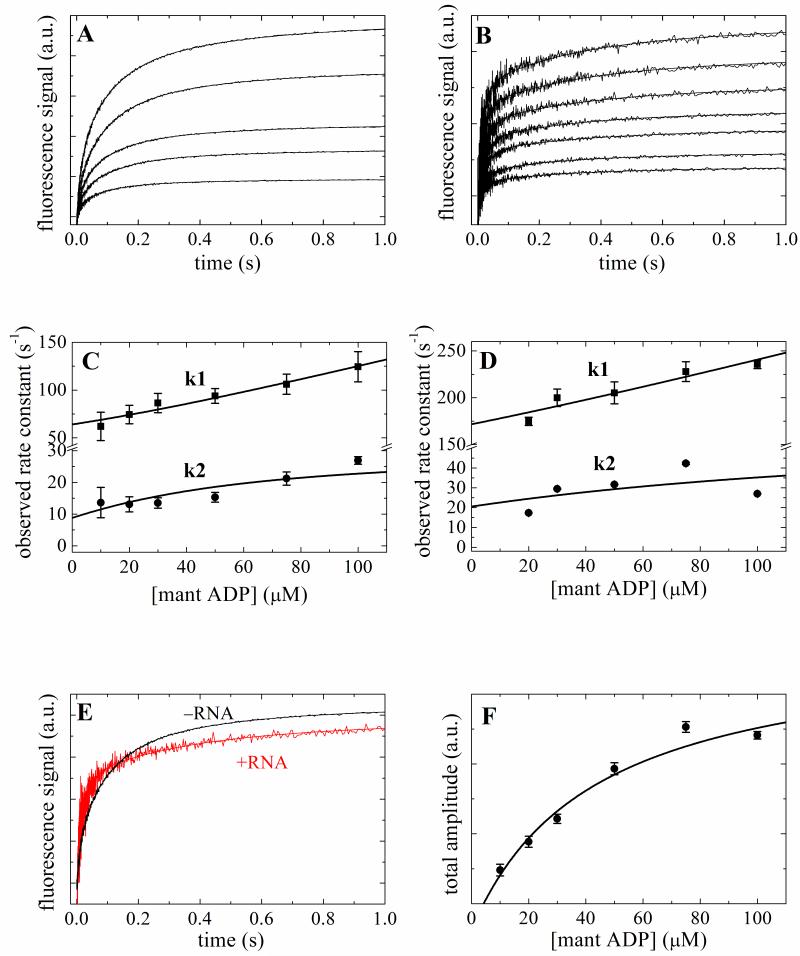
Figure 3. Kinetics of mantADP binding to Mss116 and Mss116-RNA.
Time courses of fluorescence change after mixing a range of [mantADP] with 2 μM Mss116 (Panel A) or Mss116–RNA (Panel B). The smooth lines through the data are the best fits to a sum of exponentials. [mantADP]-dependence of the observed rate constants of mantADP binding to Mss116 (Panel C) or Mss116-RNA (Panel D). The solid line through the data represents the best fit to quadratic equations Eq. 4 3; 25 for two-step binding. E. Comparison of the time courses of 50 μM mantADP binding to Mss116 and Mss116-RNA. F. The [mantATP]-dependence of the total fluorescence change amplitude associated with mantATP binding to Mss116. The solid line is the best fit to a hyperbola, for which the K0.5 presents the overall mantADP-Mss116 equilibrium binding constant.

