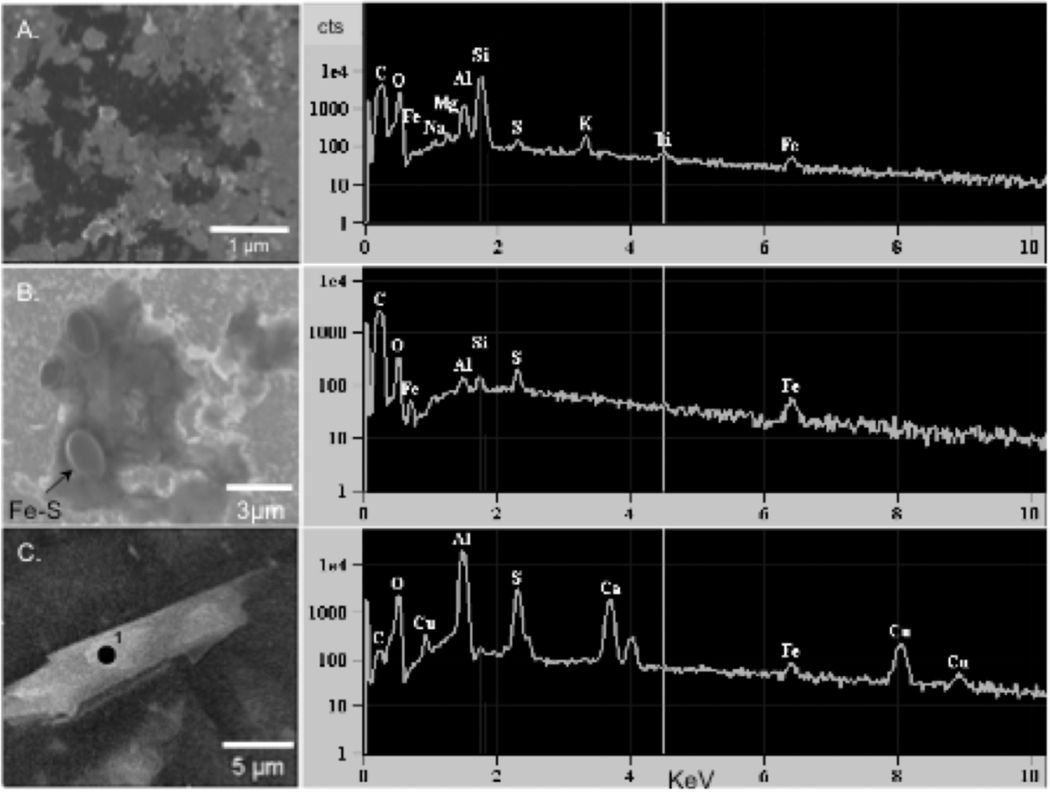
Figure 2.
SEM images using 30 kV, 2.1 nA current, (A) Clay particles on graphite (dark substrate). EDS (right) shows elements over a rastered area, (B) Close up of Fe–S spherules in aluminosilicate matrix. EDS spectrum is rastered over spherules, (C) Lath shaped particle with high Ca, S, and O (black dot) interpreted as gypsum or jarosite.

