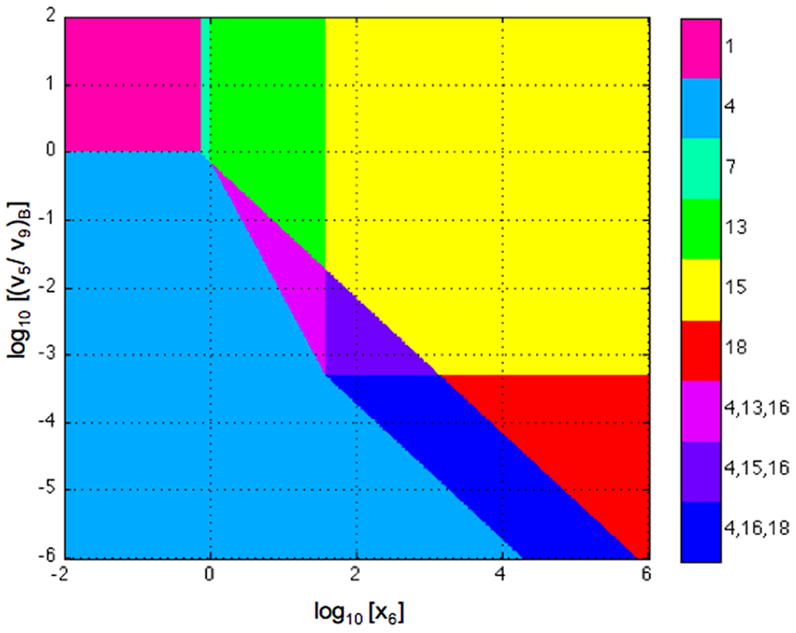
Fig. 12.

System design space for the looped DNA model in Section 6.2. Ratio of primary to alternative flux at the basal steady state as a function of normalized input concentration. Stable steady states with the basal rate of transcription (Regions 1 and 4). Stable steady states with the maximal rate of transcription (Regions 15 and 18). Stable steady states with intermediate rates of transcription (Region 7 and 13). Unstable steady state with intermediate rates of transcription that lead to hysteresis (Region 16). The parameters in this case are n = 2, ρ = 1000, θ = 18, and φ = 1.4.
