
Fig. 2.
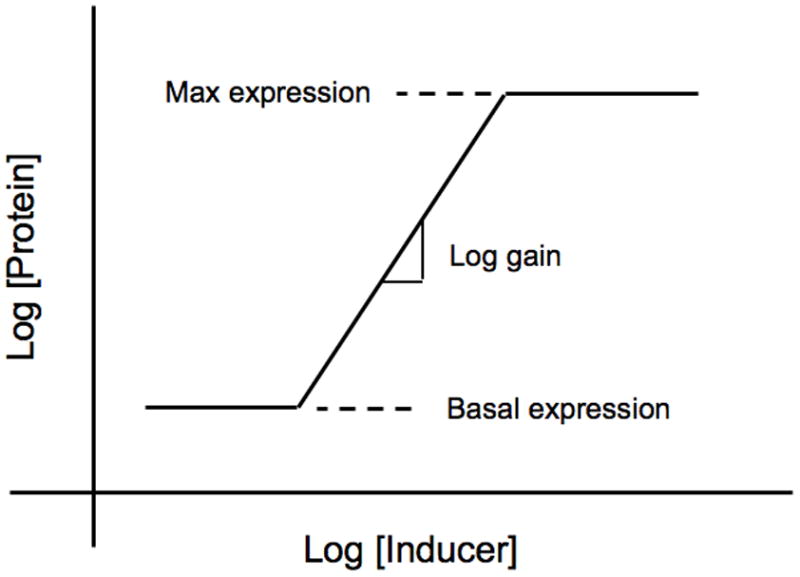
Idealized steady-state induction characteristic. Cells are grown for several generations in fixed concentrations of inducer to achieve a steady state and the resulting level of gene expression is determined. Gene expression can be measured in several ways, but the most common is to measure the level of an encoded protein, as is show in this illustration. The results are plotted in log-log coordinates. At sub-threshold concentrations of inducer there is a basal level of expression. At high concentrations of inducer there is a maximal level of expression. At intermediate levels of inducer there is a region of regulated expression in which the slope is quantified by the logarithmic gain in expression.