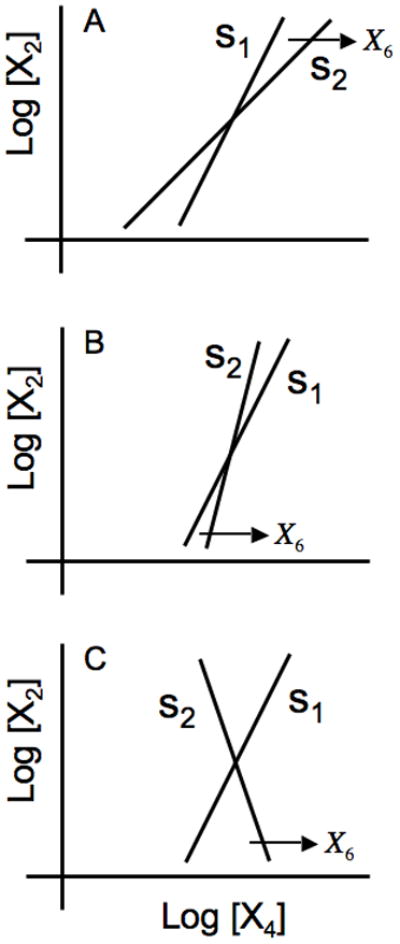
Fig. 3.

Graphical depiction of the steady-state solutions in the local power-law representation. The open-loop transfer function from X4 to X2 is represented by the line with slope s1 ; that from X2 to X4 is represented by the line with slope s2 whose horizontal displacement is a function of the substrate concentration X6. (A) s1 > s2 > 0. (B) s2 > s1 > 0, and (C) s1 > 0 > s2. See text for discussion.
