Fig. 5.
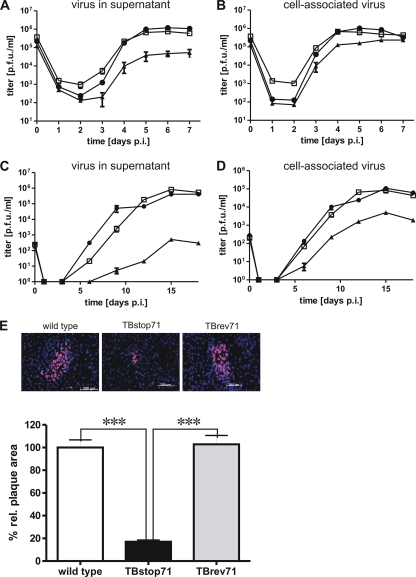
Growth characterization of TBstop71 virus. (A and B) Growth kinetics of wild-type (□), TBstop71 (▴), and TBrev71 (•) viruses. HFFs were infected with an MOI of 3. Culture supernatants (A) and cell-associated virus particles (B) were sampled at the indicated times postinfection, and virus yields were determined by titration on HFFs. Day 0 values represent the inocula. Each data point and error bar represents the mean ± the standard error of at least three independent experiments. (C and D) Multistep growth kinetic of wild-type (□), TBstop71 (▴), and TBrev71 (•) viruses. HFFs were infected with an MOI of 0.01. Culture supernatants (C) and cell-associated virus particles (D) were sampled at the indicated times postinfection, and virus yields were determined by titration on HFFs. Day 0 values represent the inocula. Each data point and error bar represents the mean ± the standard error of at least three independent experiments. (E) Plaque assay of wild-type, TBstop71, and TBrev71 virus-infected HFFs. Cells were infected with 100 PFU. After 24 h, the cells were overlaid with methylcellulose and fixed with methanol at 9 days postinfection. Infected cells were detected by an anti-IE1/2 and UL44 monoclonal antibody. The proteins were visualized by a Cy3-conjugated secondary goat anti-mouse antibody. Nuclei were marked with DAPI. The plaque areas of wild-type, TBstop71, and TBrev71-virus infected cells were analyzed with the Axio-Observer.Z1 fluorescence microscope using a ×10 objective lens. For the statistical analysis, the relative plaque areas of wild-type, TBstop71, and TBrev71 virus-infected cells were measured by the program ImageJ. The mean percentage of the areas and standard error were determined by counting at least 50 plaques in each experiment. (The experiments were repeated at least two times; ***, P < 0.0001.)

