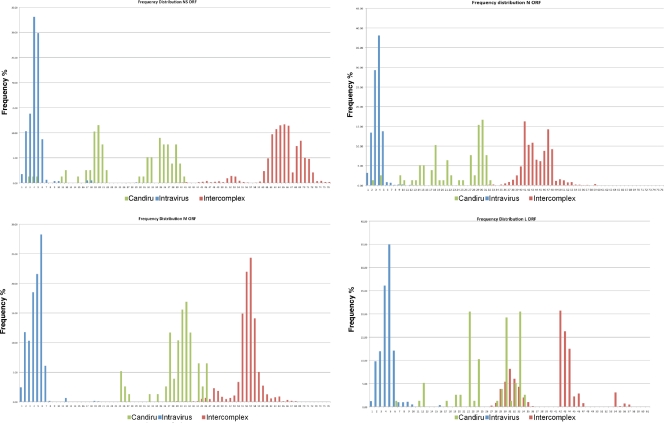
Fig. 6.
Pairwise sequence analysis. To establish a potential cutoff for phlebovirus classification, we pursued pairwise sequence comparison of all published phlebovirus sequences. Calculations were performed using MEGA software (33) to calculate the p-distance of each segment at the nucleotide level. p-distance values were grouped in three groups representing: blue, distances among different strains of the same virus (intraspecies); red, distances between members of different species (intergroup); and green, distances among members of the Candiru complex.

