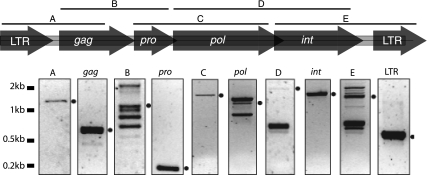
Fig. 4.
M. eugenii RT-PCR. Expression analysis of complete KERV genomic transcripts from Macropus eugenii total RNA by RT-PCR. (Top) Map of expected products on the basis of genomic DNA; (bottom) actual RT-PCR results for specific regions. The ladder is shown to the left, and the predicted band is indicated with a dot to the right of each panel.

