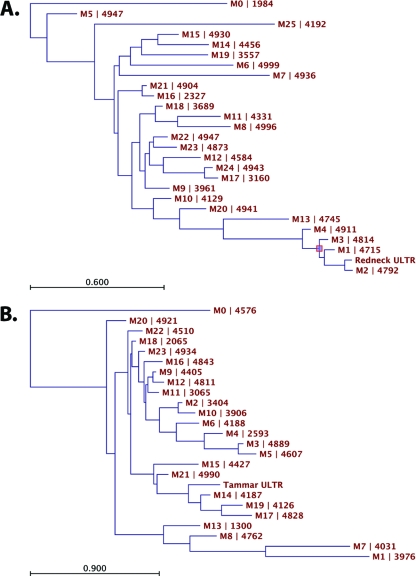
Fig. 8.
Maximum-likelihood analysis of KERV LTR divergence. Maximum-likelihood trees of M. rufogriseus (A) and M. eugenii (B) reference sequence and KERV LTR sequences from clustering analysis. The HKY model of nucleotide evolution was used for tree construction. Notice the different scales associated with branch lengths. All sequence names begin with an M, followed by the number of the clusters that they represent; the number appearing after the pipe character indicates how many sequences were assigned to that cluster.

