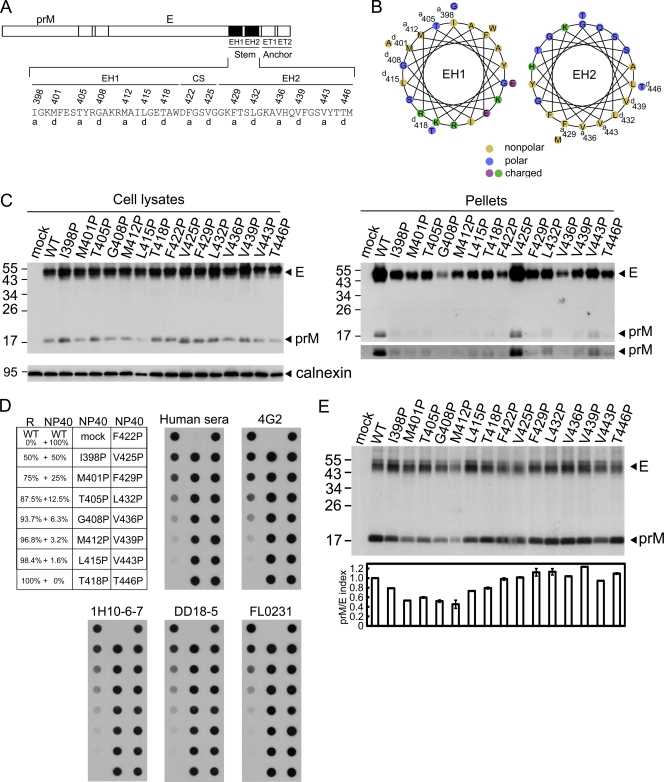
Fig. 1.
Schematic drawing of the stem region of DENV4 E protein, expression, production of VLPs, and prM-E heterodimerization of proline mutants. (A) The C terminus of E protein contains two α-helical domains (EH1 and EH2) and a stretch of CSs in between, followed by two transmembrane domains (ET1 and ET2) (60). Single-letter designations of amino acids are shown, with numbers above indicating the positions of residues at the a or d position of the helical wheel. (B) Helical wheel analysis of the EH1 and EH2 domains revealed an amphipathic helix with hydrophobic residues at the a or d position facing one side and charged or polar residues facing the other side. (C) At 48 h posttransfection, 293T cell lysates and pellets derived from culture supernatants of WT pCB-D4 or mutants were subjected to Western blot analysis using serum from a human dengue case (16, 55) and anticalnexin MAb for cell lysates (lower gel, left). The long-exposure gels for prM bands in pellets are shown (lower gel, right). One representative experiment of three is shown. (D) Dot blot binding assay by using different mouse anti-E MAbs, including flavivirus group-reactive MAbs recognizing domain II (4G2, FL0231), complex-reactive MAb (DD18-5), and type-specific MAb (1H10-6-7), as well as mixed human sera to recognize WT and mutant E proteins (from panel C) in 1% NP-40 lysis buffer and mixtures containing decreasing amounts of native WT E protein in 1% NP-40 lysis buffer and increasing amounts of denatured E protein in reducing (R) buffer. (E) 293T cells transfected with WT or mutants were labeled with [35S]Met, immunoprecipitated with anti-E MAb FL0232, and subjected to SDS-12% PAGE. The prM/E index of a mutant is equal to (intensity of mutant prM band/intensity of WT prM band)/(intensity of mutant E band/intensity of WT E band). Data are means and standard errors from two experiments. The sizes of the molecular mass markers are shown in kDa.

