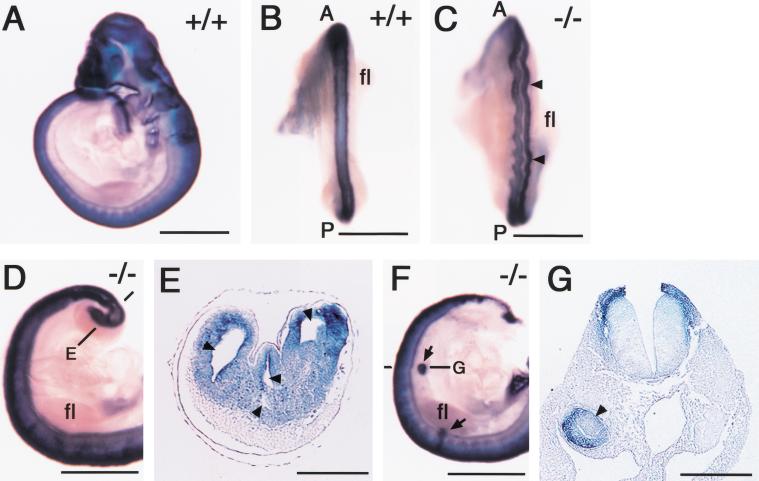
Figure 5.
Ectopic neural structures in CYP26−/− embryos. (A–G) Expression of Sox2 in wild-type (A,B) and CYP26−/− (C–G) embryos at E9.5. (B,C) Dorsal view of the neural tube. The arrowheads in C indicate irregular folding of the neural tube. (A) Anterior; (P) posterior; (fl) forelimb. (D,E) Formation of multiple neural tubes. The level of the section shown in E is indicated. The arrowheads in E indicate multiple neural tubes. (F,G) Ectopic neural tube formation. The arrows in F indicate ectopic neural tubes in the trunk. The level of the section shown in G is indicated. The arrowhead in G indicates an ectopic neural tube. Scale bar, 1 mm for A–D,F; 200 μm for E,G.

