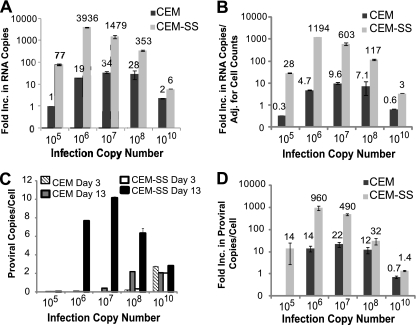
Fig. 2.
Increase in virus production and proviral copy numbers in infected CEM and CEM-SS cells. (A) CEM and CEM-SS cells were infected as described for Fig. 1A, and the increase in virus production was determined as described for Fig. 1H. (B) The increase in virus production from panel A was adjusted to the increase in cell numbers. (C) Increase in provirus copy number per cell. Infected cells were collected at day 3 and day 13, and genomic DNA was isolated. Equal amounts of DNA (500 ng) were used to detect XMRV proviral copies by quantitative real-time PCR with XMRV gag primers and probes. XMRV copy numbers were normalized to CCR5 copy numbers. The error bars indicate standard deviations of quadruplicate measurements of a representative experiment of two independent experiments. (D) Increase in XMRV proviral copies per cell from day 3 to day 13. The proviral copy numbers obtained from day 13 were divided by the proviral copy numbers from day 3 to determine the increase in proviral copy numbers per cell.

