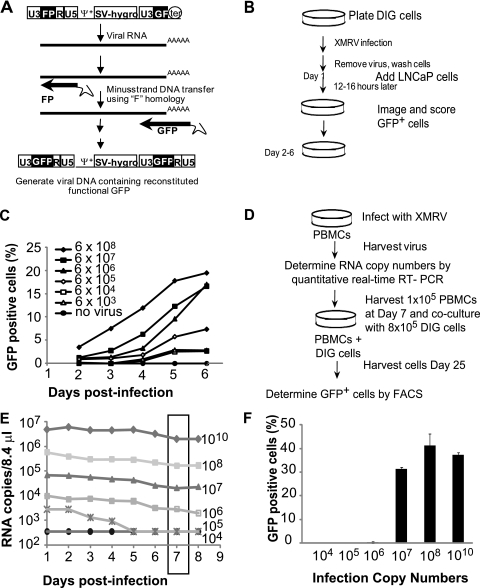
Fig. 5.
Characterization of DIG cells and isolation of replication-competent XMRV from infected PBMCs. (A) Structure of MLV-based vector pMS2. FP, the 3′ 462-bp fragment of GFP; GF, the 5′ 350-bp fragment of GFP; Ψ+, the extended MLV packaging signal; SV-hygro, hygromycin phosphotransferase B gene under the control of the SV40 promoter; ter, SV40 termination signal. GFP was reconstituted upon F region-mediated minus-strand strong-stop transfer during reverse transcription. (B) Overview of the experimental procedure used to test the DIG XMRV reporter cell line. D17 cells stably transfected with the pMS2 vector were infected with serial 10-fold dilutions of XMRV or no XMRV. LNCaP cells were added 1 day postinfection. The cells were imaged and scored for GFP daily beginning at 2 days postinfection. (C) DIG cells were infected with serial 10-fold dilutions of XMRV or no XMRV. LNCaP cells were added 1 day postinfection. The cells were analyzed by high-content imaging and scored for GFP daily beginning at 2 days postinfection. Spread of XMRV through coculture of DIG and LNCaP cells is represented by the percentage of cells that expressed GFP. RNA copy numbers of the XMRV stock used to infect the DIG cells were determined by quantitative real-time RT-PCR. A representative experiment of three independent experiments is shown. (D) Protocol for recovering replication-competent XMRV from infected PBMCs in DIG cells. PBMCs (6 × 10⁶) were infected with different XMRV as described for Fig. 3A, and virus production was quantified by real-time RT-PCR. At 7 days postinfection, 1 × 10⁵ PBMCs were cocultured with 8 × 10⁵ DIG cells. Virus recovery was detected by the percentage of GFP-positive cells. (E) Virus production in PBMCs infected with different amounts of XMRV. At 7 days postinfection, 1 × 10⁵ infected PBMCs were collected from each infection and added to 8 × 10⁵ DIG cells in six-well dishes. (F) At 3 days postcocultivation, the cells were transferred to a 10-cm dish, and the percentages of GFP-positive cells were determined after 25 days using FACS analysis. The averages of two independent experiments using two different donors are shown. Error bars represent the standard deviations.

