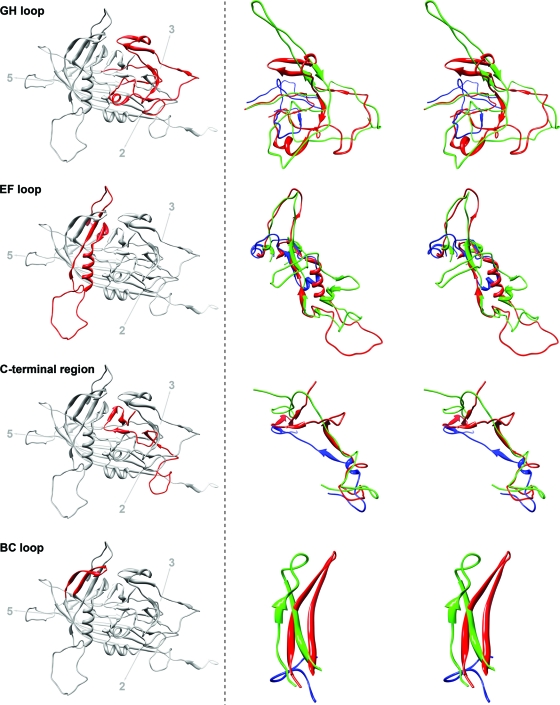
Fig. 3.
Structure comparison of loops GH, EF, BC, and the C-terminal region of BmDNV-1 with those of GmDNV and PstDNV. Left, a ribbon diagram of the BmDNV-1 capsid protein indicates the position of the particular loop (red) relative to the icosahedral symmetry axes. Right, close-up stereo views of the superpositioned loop regions of BmDNV-1 (red), GmDNV (green), and PstDNV (blue).

