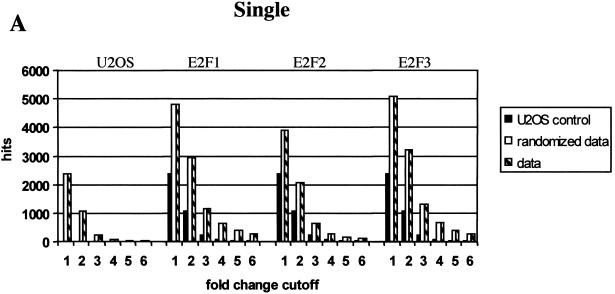
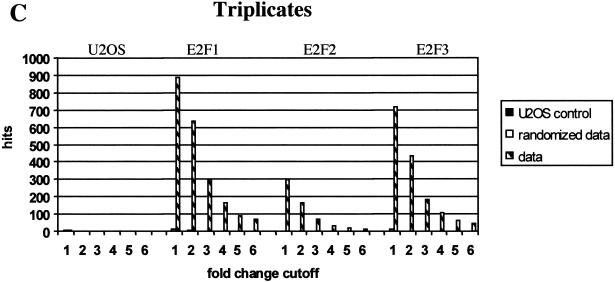
Figure 2.
Analysis of gene expression changes. The columns represent numbers of regulated genes (hits) in one (A ), two (B), and three (C) independent measurements. A gene is called regulated when its difference call is induced/moderately induced (I/MI) for up-regulated genes and decreased/moderately decreased (D/MD) for down-regulated genes in all replicates and the fold change (FC) is equal to or beyond the fold-change cutoff in all replicates (FC ≥ cutoff for up-regulated genes or FC ≤ cutoff for down-regulated genes). Checkered bars represent the data. Black bars represent U2OS noise lists (derived from comparing U2OS control chips to each other). White bars represent randomized data lists. See Materials and Methods for details.


