
Table 2.
E2F-induced expression changes for selected genes: Summary call and verification
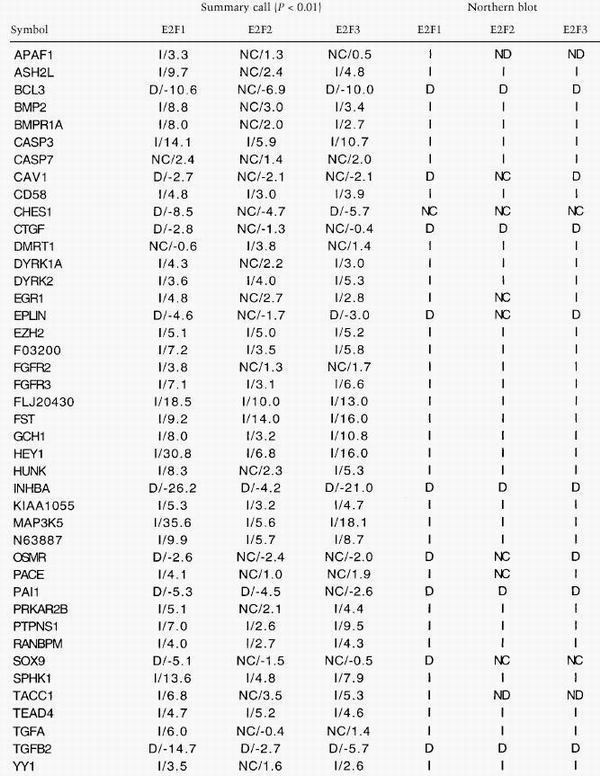 |
Symbols are given for each gene as in Table 1. Two genes do not have an assigned symbol, and their accession numbers are given. The average fold change in expression for a gene is shown. The summary call (P < 0.01) is calculated using the McNemar test as described in the text. The verification of all genes have been performed by Northern blotting, and calls are based on these results (Figs. 3,4; data not shown).
(ND) Not determined.