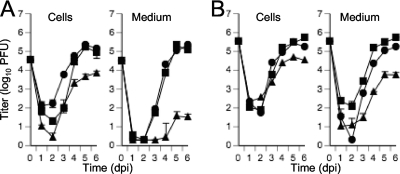
Fig. 2.
Multistep (A) (MOI of 0.3) or single-step (B) (MOI of 3) growth curves of Towne-BAC (squares), UL103-R (circles), and UL103-Stop-F/S (triangles) reconstituted viruses. The cells and medium were harvested at the indicated times postinfection and frozen at −80°C. The virus titer was determined in triplicate by plaque assay on HF and graphed as log10 mean value ± SD. The data point at 0 dpi indicates the input virus dose.

