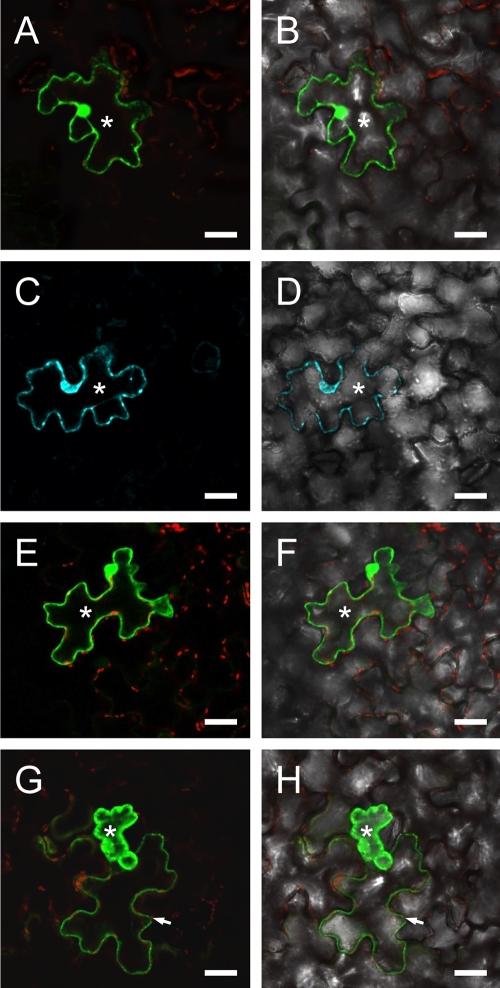
Fig. 6.
Cell-to-cell movement of GFP-MP fusion expressed in epidermal cells. Agro-suspensions precisely diluted at an optical density at 600 nm of 0.5 were agroinfiltrated in 1/10 serial dilutions until single-cell transfection was obtained. Only fully developed N. benthamiana leaves were agroinfiltrated. All pictures correspond to the 10−3 dilution. Fluorescence images (A, C, E, and G) are overlaid with the respective bright-field images (B, D, F, and H). (A and B) Localization of pBinGFP-CP fluorescence limited to the transfected epidermal cell (asterisk). The weak red signal (A and B, E and F, and G and H) derives from excitation of chloroplast autofluorescence in the mesophyll. Analogous single-cell localization (asterisk) of pBin-CFP (C and D) fluorescence is visible as well as for pBin-GFP (E and F). When pBin-GFP-MP was agroinfiltrated (G and H), fluorescence leaked from the transfected cell (asterisk) to the neighboring cells (arrowhead). Bar, 20 μm.

