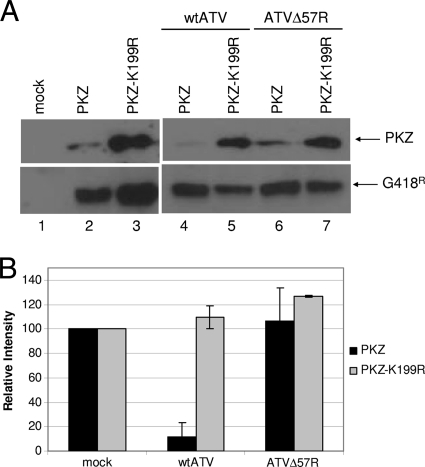
Fig. 6.
PKZ regulation by ATV. (A) PKZ assay. FHM cells were transfected with pcDNA3.1-PKZ, the active form of PKZ, or pcDNA3.1-PKZ-K199R, the inactive form of PKZ, and the cells were incubated for 24 h. At that time, cells were either mock infected or infected with wtATV or ATVΔ57R at an MOI of 5. Cells were harvested at 8 hpi, and protein extracts were obtained. Western blot analysis of equal cell volumes was analyzed using primary antibodies specific to PKZ C-terminal 6×His and Myc tags (Rockland) or anti-G418 phosphatase (Abcam) followed by chemiluminescence. (B) PKZ quantification. PKZ and PKZ-K199R proteins observed in the Western blots were quantified using the ImageQuant 5.2 software (GE Healthcare). The relative intensity of each PKZ protein from ATV- and ATVΔ57R-infected cells was normalized to PKZ levels of mock-infected cells. Data presented are the averages and standard errors of results from two independent experiments. *, nonspecific proteins or potential degradation products as described by Rothenberg et al. (57).

