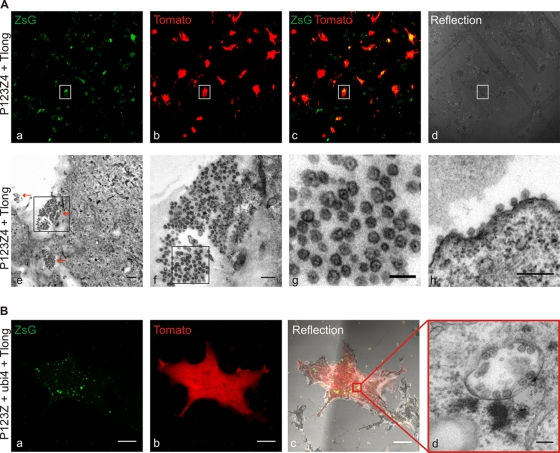
Fig. 7.
Spherule formation studied by CLEM. (A) BSR cells on MatTek grid dishes were cotransfected with P1234Z and template Tlong. The sample was fixed at 24 h posttransfection and imaged with a confocal microscope for correlation (upper panel). (a to c) ZsGreen and Tomato coexpression was taken as an indication for active replication. (d) Reflection image was acquired to visualize the grid and relocate the cells at the EM level. The boxed cell was chosen for further characterization with EM (lower panel). (e) Bottom sections of the relocated cell showed large amounts of spherules, as analyzed with TEM. Three large clusters of spherules are indicated with red arrows. Bar, 500 nm. The boxed area illustrating one large cluster of spherules at the bottom of the cell is shown in the image in panel f, in which the scale bar is 200 nm. (g) Zoomed in area of the boxed area in panel f of the clustered spherules showing a characteristic dark dot inside the structures. Bar, 100 nm. (h) Clusters of spherules were also found at the plasma membrane on the rim of the cell. Bar, 200 nm. (B) Cotransfection of P123Z-ubi4-Tlong. The sample was prepared for CLEM as described for panel A. A confocal optical slice highlights the ZsGreen-positive structures (a) and Tomato expression (b) in the cell analyzed in an EM. (c) A reflection image was used to relocate the cell at the EM level. (a to c) Bars, 10 μm. (d) A relocated cell was analyzed with EM. A representative modified endolysosome (cytopathic vacuole) with numerous spherules is illustrated. Bar, 100 nm.

