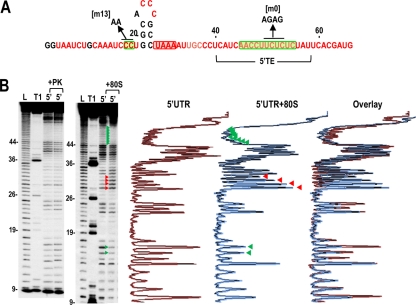
Fig. 5.
In-line cleavage profiles of the 5′ UTR in the presence and absence of 80S ribosomes. (A) Structure of the 5′ UTR of TCV. The location of the 5′ TE is shown. Residues in red are flexible and susceptible to cleavage, with color intensity reflecting the degree of cleavage. Green and red boxes denote residues that have reduced or enhanced susceptibility to cleavage, respectively, in the presence of 80S salt-washed ribosomes. Locations of mutations used for ribosome binding assays are shown. (B) Autoradiograph of in-line cleavage analysis of 5′-labeled 5′ UTR in the presence and absence of proteinase K (+PK) (left) or 80S ribosomes (+80S) (right). Green and red arrowheads denote residues whose cleavage pattern was altered by the presence of ribosomes in all three replicates. L, partial hydroxide cleavage ladder; T1, partial RNase T1 digest of denatured RNA showing the location of guanylates; 5′, 5′ UTR in-line cleavage profile. Numbering is from the 5′ end of the gRNA. Densitometer tracings of the 5′ UTR and 5′ UTR + 80S ribosome lanes and an overlay of the two tracings are shown to the right. Residues with consistent differences in all three replicates (enhanced or reduced cleavages) are denoted by red and green arrowheads, respectively.

