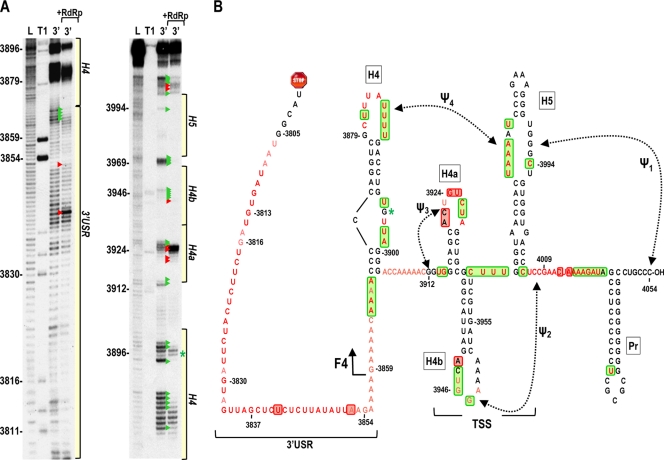
Fig. 6.
In-line cleavage profile of the TCV 3′ UTR. (A) 5′-labeled 3′ UTR transcripts were subjected to in-line cleavage in the presence and absence of purified RdRp. A short run and a longer run of the same samples are shown. L, partial hydroxide cleavage ladder; T1, partial RNase T1 digest; 3′, 3′ UTR in-line cleavage profile; 3′ +RdRp, an equal molar amount of RdRp was added before in-line cleavage. Base numbering is from the 5′ end of TCV. Green and red arrowheads denote residues whose cleavage pattern was altered by the presence of RdRp in all replicates. The locations of the 3′ USR and hairpins shown in panel B are shown. (B) Secondary and tertiary structures of the 3′ region of TCV. Locations of the TSS, which includes hairpins H4a, H4b and H5, and two pseudoknots (Ψ2 and Ψ3), and H4 and the 3′ USR are denoted. The endpoint of the previously analyzed F4 fragment is shown. Residues in red are flexible and susceptible to cleavage, with color intensity reflecting the degree of cleavage. Green and red boxes denote residues that have reduced or enhanced susceptibility to cleavage, respectively, in the presence of RdRp. An asterisk denotes a single difference in the RdRp-mediated conformational shift in the F4 fragment compared to the full 3′ UTR. This cleavage is not present in the F4 fragment in the presence of RdRp.

