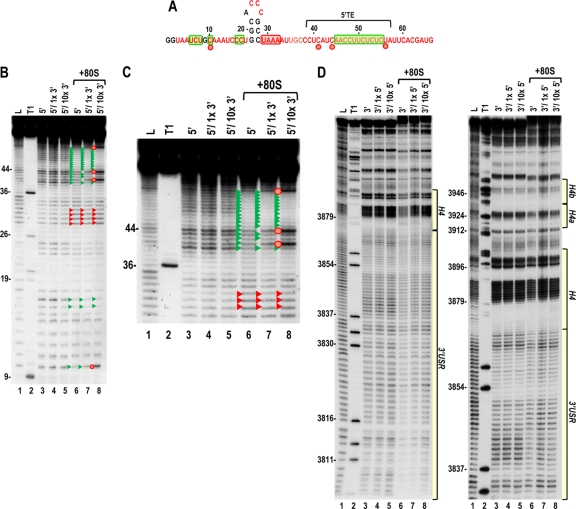
Fig. 9.
The ribosome-mediated cleavage profile of the 5′ UTR is altered in the presence of the 3′ UTR. (A) Structure of the TCV 5′ UTR. Residues in red are flexible and susceptible to cleavage, with color intensity reflecting the degree of cleavage. Green and red boxes denote residues that have reduced or enhanced susceptibility to cleavage, respectively, in the presence of 80S ribosomes alone. Red circles denote residues with enhanced cleavage in all three replicas in the presence of ribosomes and 10× unlabeled 3′ UTR. (B) Cleavage profile for the 5′ UTR in the presence and absence of 1× or 10× unlabeled 3′ UTR and 80S ribosomes. Red and green arrowheads denote residues that show enhanced or reduced cleavage, respectively, in the presence of 80S ribosomes (as also shown in Fig. 4B). Red circles denote residues with enhanced cleavage in the presence of ribosomes and 10× unlabeled 3′ UTR. Note that the cleavage profiles for the 5′ UTR and 5′ UTR plus 1× or 10× unlabeled 3′ UTR are identical, indicating no discernible RNA-RNA interactions in the absence of ribosomes. (C) An enlargement of the upper portion of the gel shown in panel B. (D) Cleavage profile for the 3′ UTR in the presence and absence of 1× or 10× unlabeled 5′ UTR and 80S ribosomes. Note no differences in the cleavage profile between lanes 3 to 5 or lanes 6 to 8.

