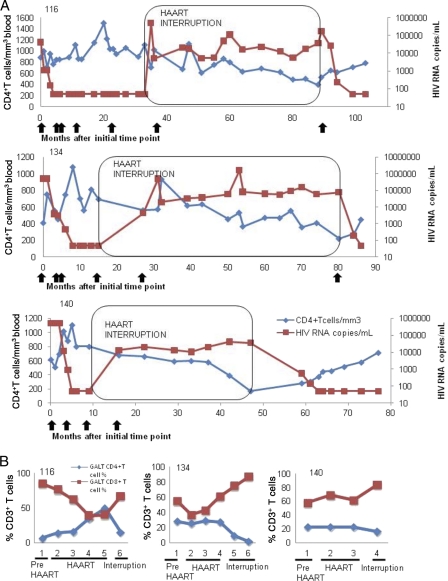
Fig. 2.
Measurement of HIV loads and CD4+ T cell numbers in longitudinal samples of peripheral blood and GALT of HIV-infected patients prior to and post-HAART interruption. (A) CD4+ T cell numbers (blue) and HIV RNA copies/ml(red) are plotted across time (in months). Arrows underneath each panel represents the time of GALT sample collection from each patient and represent time points as they are indicated in Fig. 1. The boxed area indicates the time period of therapy interruption. (B) CD4 (blue) and CD8 (red) T-cell percentages from GALT.

