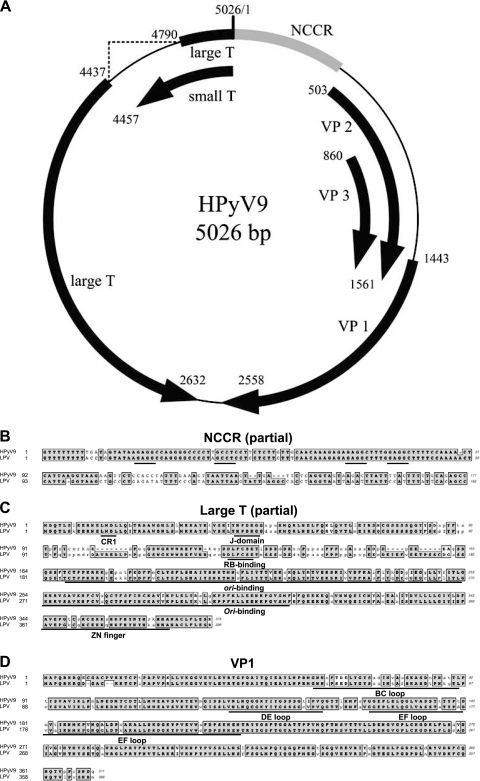
Fig. 1.
Genome map of HPyV9 and comparison of encoded proteins with those of LPV. (A) Genome organization of HPyV9. Putative coding regions for VP1 to VP3, small T antigen, and large T antigen are marked by arrows. (B) Part of the noncoding control region (NCCR) of HPyV9 was aligned with that of LPV using ClustalW (as implemented in MacVector 10.6). Conserved regions are outlined and shaded. T antigen binding elements (GAGGC or the complement GCCTC) are underlined. (C) Comparison of HPyV9 and LPV large T proteins. The CR1, J, RB-binding, ori-binding, and Zn finger domains are underlined. (D) Comparison of VP1 proteins. VP1 loops are underlined. For panels C and D, identical amino acids (in bold type) are outlined and shaded, similarities (in bold type) are outlined only, and mismatches are in normal, lowercase type.

